



A K-shaped economy is a recovery in which parts of society move in opposite directions. One cohort sees rising wealth; the other stagnates or declines in real terms. Plotted over time, the paths form a K: a common origin, then one arm rising and the other falling.
FIGURE 01
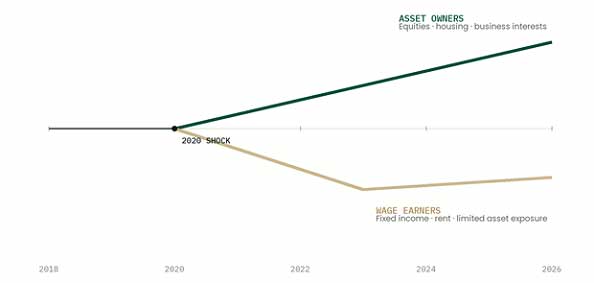
A Stylized K-shaped economy: Divergence after a shock
The upper arm owns assets: equities, property, and business interests. The lower arm depends on wages and pays rent. Whenever asset prices rise faster than wages, the arms diverge, and ownership is highly concentrated. Federal Reserve data show the top 1% of US households holding roughly half of all corporate equities, while the bottom 50%, more than 160 million people, holds about 1%.
FIGURE 02
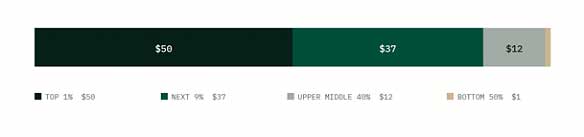
Ownership of US corporate equities, per $100, by household group
2. The post-pandemic divergence, 2020 to 2026
Governments deployed roughly $17 trillion in pandemic fiscal support, and the Federal Reserve more than doubled its balance sheet to $8.9 trillion. This very likely averted a depression, but it was not neutral. New liquidity flowed first into asset markets: upper-arm assets roughly doubled in price, consumer prices rose sharply, and typical real wages were flat.
The gap then compounded: the top decile’s share of US consumer spending reached a record 49.2% in 2025, while subprime auto delinquencies hit a 32-year high. The pattern is global: in the pandemic’s first year, billionaire wealth rose by about $5 trillion while an estimated 100 million people fell into extreme poverty.
FIGURE 03
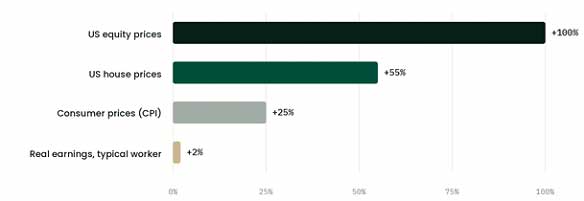
Cumulative change, February 2020 to mid-2026
3. Policy responses: two failures and three successes
Policymakers typically reach for wealth taxes or monetized transfers. Both are popular. Both are counterproductive.
Wealth is mobile. France’s wealth tax saw an estimated 42,000 millionaires emigrate and, by economist Eric Pichet’s calculation, drove roughly 200 billion euros abroad, costing the state twice what it collected. Norway raised its wealth tax in 2022, lost a record number of wealthy citizens to Switzerland, and collected less, not more. When an entrepreneur leaves, the state forfeits an entire tax footprint: income tax, the taxes and jobs of their firms, and every firm they would have founded at home. In open economies, wealth taxation is a subsidy to competing jurisdictions.
Monetized transfers fail for the opposite reason. New money reaches asset markets first and consumer prices second, so inflation is their principal consequence, and inflation is regressive: the lower arm holds cash and earns fixed wages, while the upper arm holds equities, property, and foreign currency that rise with it. When Pakistan’s inflation peaked at 38% in 2023, asset and dollar holders were insulated while wage earners absorbed the loss. Monetary financing is a transfer running the wrong way.
The three most successful postwar reductions of the divergence used neither remedy. They made workers owners by default, or freed housing supply.
FIGURE 04
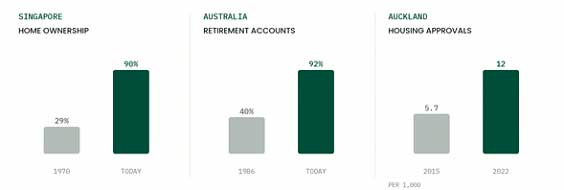
Ownership and supply reforms: outcomes before and after
Singapore, from 1968: mandatory payroll contributions flow into individually owned accounts that can buy public housing. Home ownership rose from 29% in 1970 to about 90% today, including 87% of the lowest income quintile, inside one of the world’s most open economies.
Australia, from 1992: compulsory superannuation directs part of every wage into the employee’s own investment account. Coverage exceeds 90% of workers, balances approach A$4 trillion, and Australia has the world’s second-highest median wealth per adult.
Auckland, from 2016: the city rezoned most residential land for construction. Approvals roughly doubled, rents sit about a fifth below trend, and the fiscal cost was zero. The binding constraint on housing is regulation, not land or materials.
Rent rises with inflation and builds no asset; a fixed mortgage payment stays constant, then ends, leaving a home. Cash lost about 25% of its purchasing power since 2020; equities have returned 6 to 7% a year in real terms for a century. Broad ownership does not dilute capitalism; it gives it its widest base of support.
FIGURE 05
Monthly housing cost over 25 years: renter versus owner
4. Application: Pakistan and the National Ownership Account
Pakistan is an acute case: 44.7% of the population lives below the World Bank poverty line, elite privileges cost an estimated $17.4 billion a year, and roughly 0.2% of Pakistanis hold listed equities, against 6% in India. One arm holds under-taxed real estate and foreign currency; the other holds depreciating rupees.
The proposed response is the National Ownership Account (NOA): one investment account per citizen, linked to the CNIC, heritable, and legally insulated from state seizure. Formal workers contribute 12% of wages (7% employer, 5% employee), phased in over five years. Informal workers, roughly 70% of the labor force, may deposit from Rs100 via mobile, matched one-for-one by the state up to a ceiling, funded by land monetization and privatization, not taxes. Remittances into a relative’s account earn a 5% supplement.
Allocation is 40% domestic equities, 15% international equities, 20% government bonds under a statutory ceiling so the fund never becomes a captive lender to the state, 15% new housing construction (existing plots excluded, so the fund cannot inflate the prices its members pay), and 10% revenue-generating infrastructure. As state assets are privatized, the fund is their standing buyer.
FIGURE 06
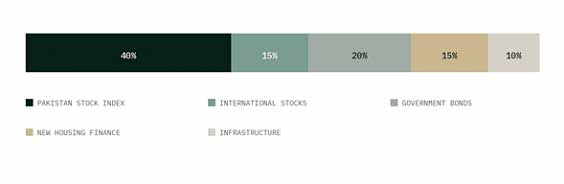
National Ownership Account: Target allocation
Balances may fund a first-home down payment and mortgage service; contributions then continue into a retirement sub-account, so the citizen retires with both a home and a portfolio. With mortgage credit below 1% of GDP, against 11% in India, the housing pillar also needs long-term bank finance, credit scores built on Raast and mobile-wallet histories, and enforceable collateral.
The supply-side condition is non-negotiable: the NOA launches only with construction deregulation and property titling, and provincial match rates are tied to housing approvals. Purchasing power injected into a supply-constrained market becomes higher prices, so permitting and rezoning reform are half of the design. Governance rests on an independent board, competing private asset managers, a transparent mobile app, and the debt ceiling entrenched in statute.
Finally, the Patron’s Choice lets wealthy taxpayers pay the tax, direct an equivalent sum into their own employees’ NOA accounts, or endow a named educational institution, as LUMS and Aga Khan University show is viable on Pakistani soil.
Every element is also a growth policy: titled property expands collateral, deeper capital markets cut funding costs, and infrastructure raises productivity, the only durable source of real wage growth. Redistribution tries to pull the upper arm down, and it fails. This agenda raises the lower arm instead.